The output of the activities in Shodor's Interactivate are created
dynamically by computer languages such as JavaScript. As a result, the pictures
on the screen are not something that your browser can easily print. These
instructions should enable you and your students to print out results from
your explorations, to annotate them, and to make them part of any
assessment.
Instruction for Windows Users
Please make sure that the image that you wish to print is visible on the
screen.
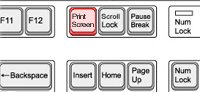
Hit the "Print Screen" key on your keyboard.
(This copies an image of your screen onto your computer's clipboard)
Open a writing or drawing program (such as Microsoft Word or "Paint")
Paint can be found at:
· All Programs · Accessories · Paint
"Paste" the image from the clipboard into the application (Edit ·
Paste).
If you're using "Paint": you can use the "crop" tool to keep only the
part of the image you wish. To use the crop tool: select the part of
the image you wish to keep, then select the "Cut" option from the file
menu and open up a new window and select the "Paste" option.
Now you may print the file using File · Print.
Instruction for Mac OS Users
Press the following keys at the same time.
Command (aka. the flower/Apple key) · Shift
· 4
You will notice that your mouse cursor becomes a cross-hair. Using the
cross-hair, create a rectangular box around the image you wish to
caputure, then release the mouse. If you make a mistake, while still
pressing down on the mouse key, hit the ESC key.
A file will be created on your desktop called "Picture Y", where "Y"
represents a number.
You can open this file in Preview and print from this program as normal.


 · All Programs · Accessories · Paint
